Screener
Vind bedrijven op wat er nu van ze waar is — het cijfer uit hun deponeringen, de aandeelkoers en hoe ver die onder de 52-weekstop staat, wat hij kost, wat hij uitkeert en of er opties genoteerd zijn. Begin bij een benoemd scherm en pas het aan.
Vaste screens
Screen aanpassen
5.418 bedrijven voldoen
Showing 1.101–1.150 of 5.418
| Bedrijf | Cijfer | Koers | Onder top | K/W | Grootte | Rend. | Opties | Sector |
|---|---|---|---|---|---|---|---|---|
 STAGSTAG Industrial, Inc. | A+ | US$ 37,10 | -11% | — | US$ 7,2B | 6,1% | Maandelijks | Reit Industrial |
 AVTAVNET, INC. | D | US$ 86,81 | -19% | 12,98 | US$ 7,1B | 1,6% | Maandelijks | Electronics and Computer Distribution |
 GLBEGlobal-E Online Ltd. | A+ | US$ 42,18 | -6% | 108,15 | US$ 7,1B | — | Maandelijks | Internet Retail |
 FSVFirstService Corporation | A | US$ 155,85 | -5% | 47,52 | US$ 7,1B | 0,6% | Maandelijks | Real Estate Services |
 OWLBLUE OWL CAPITAL INC. | B | US$ 10,19 | -35% | 72,79 | US$ 7,1B | 8,9% | Wekelijks | Asset Management |
 CMCCommercial Metals Company | B | US$ 64,70 | -21% | 11,04 | US$ 7,1B | 1,2% | Maandelijks | Metal Fabrication |
 FSSFEDERAL SIGNAL CORPORATION | A+ | US$ 116,56 | -13% | 24,18 | US$ 7,1B | 0,5% | Maandelijks | Farm and Heavy Construction Machinery |
 IBRXIMMUNITYBIO, INC. | C | US$ 6,67 | -42% | — | US$ 7,1B | — | Wekelijks | Biotechnology |
 CAGCONAGRA BRANDS, INC. | F | US$ 14,81 | -22% | — | US$ 7,1B | 8,3% | Wekelijks | Packaged Foods |
 XMTRXOMETRY, INC. | B- | US$ 122,45 | 0% | — | US$ 7,1B | — | Maandelijks | Industrial Distribution |
 CWENClearway Energy, Inc. | A | US$ 34,29 | -16% | — | US$ 7B | 5,4% | Maandelijks | Utilities Renewable |
| CAICARIS LIFE SCIENCES, INC. | A | US$ 24,50 | -32% | 14,76 | US$ 7B | — | Maandelijks | Biotechnology |
 ELFe.l.f. Beauty, Inc. | A | US$ 118,47 | -1% | 81,70 | US$ 7B | — | Wekelijks | Household and Personal Products |
 SNEXStoneX Group Inc. | C | US$ 58,02 | -37% | — | US$ 7B | — | Maandelijks | Capital Markets |
 CAVACAVA Group, Inc. | B | US$ 59,80 | -39% | 110,74 | US$ 7B | — | Wekelijks | Restaurants |
 ARWRARROWHEAD PHARMACEUTICALS, INC. | F- | US$ 49,36 | -45% | — | US$ 7B | — | Maandelijks | Biotechnology |
 TAPMolson Coors Beverage Company | D | US$ 39,68 | -25% | — | US$ 7B | 4,8% | Maandelijks | Beverages Brewers |
 BTGB2GOLD CORP | B+ | US$ 5,17 | -16% | 18,46 | US$ 6,9B | 1,3% | Wekelijks | Gold |
 KTOSKRATOS DEFENSE & SECURITY SOLUTIONS, INC. | C | US$ 36,69 | -72% | 305,71 | US$ 6,9B | — | Wekelijks | Aerospace and Defense |
 CHDNChurchill Downs Inc | C+ | US$ 100,59 | -14% | — | US$ 6,9B | 0,4% | Maandelijks | Gambling |
 SOBOSOUTH BOW CORPORATION | B+ | US$ 33,09 | -13% | 14,90 | US$ 6,9B | 5,1% | Maandelijks | Oil Gas Midstream |
 DYDYCOM INDUSTRIES, INC. | A+ | US$ 228,05 | -57% | 20,83 | US$ 6,9B | — | Maandelijks | Engineering and Construction |
 PATHUiPath, Inc. | B+ | US$ 13,13 | -32% | 19,60 | US$ 6,9B | — | Wekelijks | Software Infrastructure |
 KODKodiak Sciences Inc. | Geen cijfer | US$ 109,23 | 0% | — | US$ 6,9B | — | Maandelijks | Biotechnology |
 RIOTRIOT PLATFORMS, INC. | F- | US$ 18,27 | -36% | — | US$ 6,9B | — | Wekelijks | Capital Markets |
 FAFFIRST AMERICAN FINANCIAL CORPORATION | B | US$ 66,96 | -15% | 9,43 | US$ 6,8B | 3,4% | Maandelijks | Insurance Specialty |
| AUGOAURA MINERALS INC. | A- | US$ 81,43 | -24% | — | US$ 6,8B | 3,2% | Maandelijks | Gold |
 CVLTCommvault Systems, Inc. | B | US$ 166,68 | -3% | 86,36 | US$ 6,8B | — | Maandelijks | Software Application |
 SGOLabrdn Gold ETF Trust | Geen cijfer | US$ 37,93 | -26% | — | US$ 6,8B | — | Maandelijks | — |
 MSAMSA SAFETY INC | A+ | US$ 176,19 | -12% | 22,65 | US$ 6,8B | 1,2% | Maandelijks | Security and Protection Services |
| NAVNNAVAN, INC. | A | US$ 26,41 | -14% | — | US$ 6,8B | — | Maandelijks | Software Application |
 LADLithia Motors, Inc. | D | US$ 313,01 | -26% | 8,96 | US$ 6,8B | 0,8% | Maandelijks | Auto and Truck Dealerships |
 MSMMSC INDUSTRIAL DIRECT CO., INC. | C | US$ 120,88 | -9% | 30,37 | US$ 6,8B | 2,9% | Maandelijks | Industrial Distribution |
 NENoble Corporation plc | F | US$ 42,23 | -21% | 124,21 | US$ 6,7B | 4,7% | Maandelijks | Oil Gas Drilling |
 BIRKBirkenstock Holding plc | B+ | US$ 36,61 | -25% | 17,91 | US$ 6,7B | — | Maandelijks | Footwear and Accessories |
 PPCPILGRIM’S PRIDE CORPORATION | D | US$ 28,21 | -36% | 20,90 | US$ 6,7B | — | Maandelijks | Packaged Foods |
 ZGZILLOW GROUP, INC. | B | US$ 29,78 | -60% | — | US$ 6,7B | — | Maandelijks | — |
 WULFTERAWULF INC. | D- | US$ 13,38 | -54% | — | US$ 6,7B | — | Wekelijks | Capital Markets |
 SWXSouthwest Gas Holdings, Inc. | Geen cijfer | US$ 92,62 | -1% | 22,59 | US$ 6,7B | 2,7% | Maandelijks | Utilities Regulated Gas |
 BLDRBUILDERS FIRSTSOURCE, INC. | F | US$ 62,29 | -52% | 163,92 | US$ 6,7B | — | Maandelijks | Building Products and Equipment |
 KEXKIRBY CORPORATION | B | US$ 128,21 | -16% | 18,45 | US$ 6,7B | — | Maandelijks | Marine Shipping |
 OROR ROYALTIES INC. | A+ | US$ 35,58 | -25% | 32,64 | US$ 6,7B | 0,6% | Maandelijks | Gold |
 CPBThe Campbell’s Company | F | US$ 22,31 | -25% | 17,03 | US$ 6,7B | 6,4% | Wekelijks | Packaged Foods |
 BKHBlack Hills Corporation | F | US$ 86,91 | -0% | 20,84 | US$ 6,7B | 3,2% | Maandelijks | Utilities Regulated Gas |
 LNTHLANTHEUS HOLDINGS, INC. | B+ | US$ 101,58 | -8% | 25,08 | US$ 6,6B | — | Maandelijks | Drug Manufacturers Specialty and Generic |
 EGOELDORADO GOLD CORP /FI | B | US$ 33,45 | -32% | 13,54 | US$ 6,6B | 0,6% | Maandelijks | Gold |
 GILGILDAN ACTIVEWEAR INC. | A | US$ 35,80 | -50% | 13,71 | US$ 6,6B | 2,3% | Maandelijks | Apparel Manufacturing |
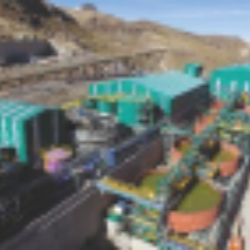 BVNBUENAVENTURA MINING CO INC | B+ | US$ 26,10 | -39% | — | US$ 6,6B | 4,2% | Maandelijks | Other Precious Metals and Mining |
 EXLSEXLSERVICE HOLDINGS, INC. | B+ | US$ 43,91 | -1% | 26,29 | US$ 6,6B | — | Maandelijks | Information Technology Services |
 FTDRFrontdoor, Inc. | B+ | US$ 97,82 | -3% | 24,33 | US$ 6,6B | — | Maandelijks | Personal Services |
Een filter is geen aanbeveling. Elke regel voldeed aan de genoemde test en niets meer — InspectStocks beschrijft bedrijven op basis van hun eigen SEC-indieningen en adviseert niet om iets te kopen of te verkopen.